
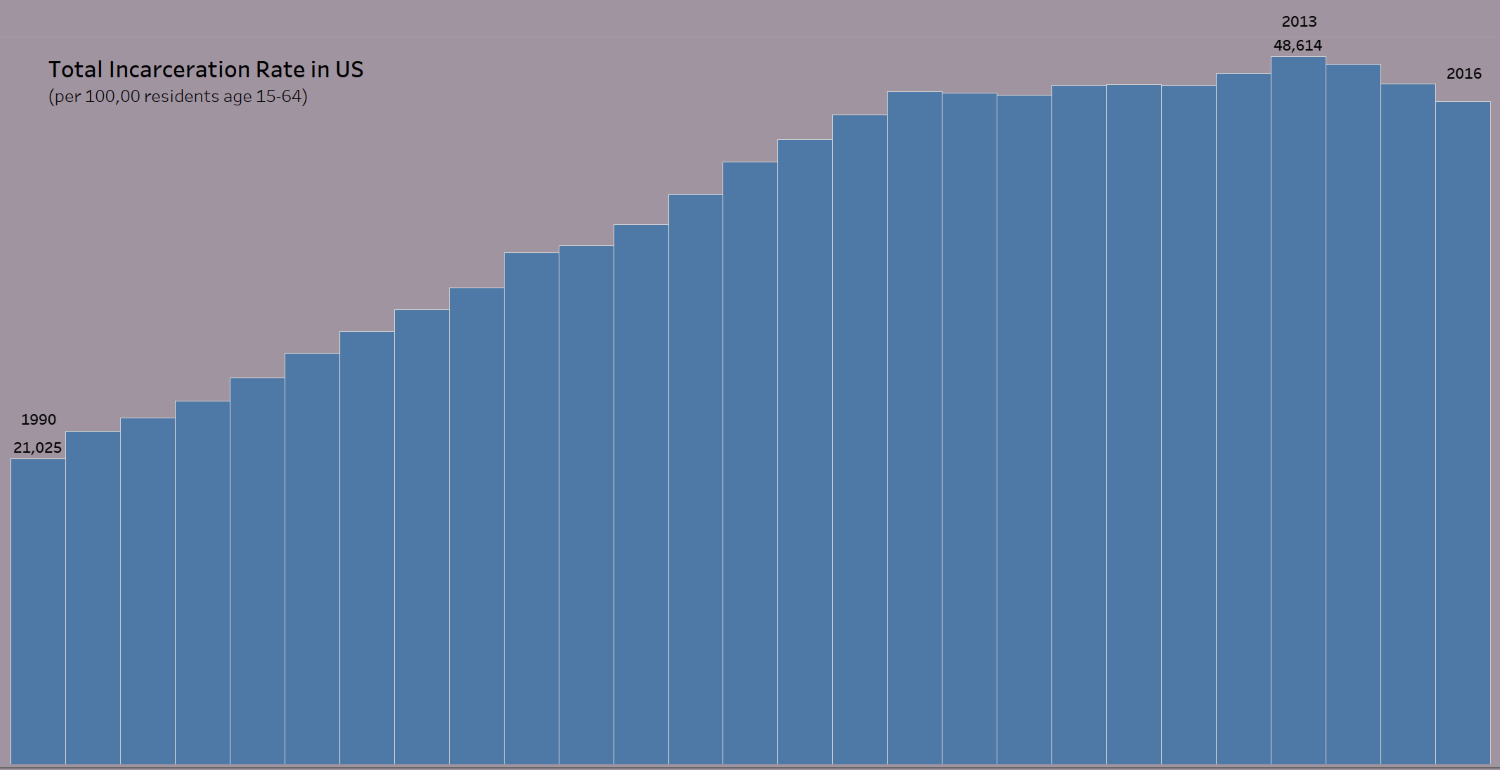
The Rate of Incarceration in the U.S. has risen steadily since 1990, peaked in 2013, then slowly started to fall
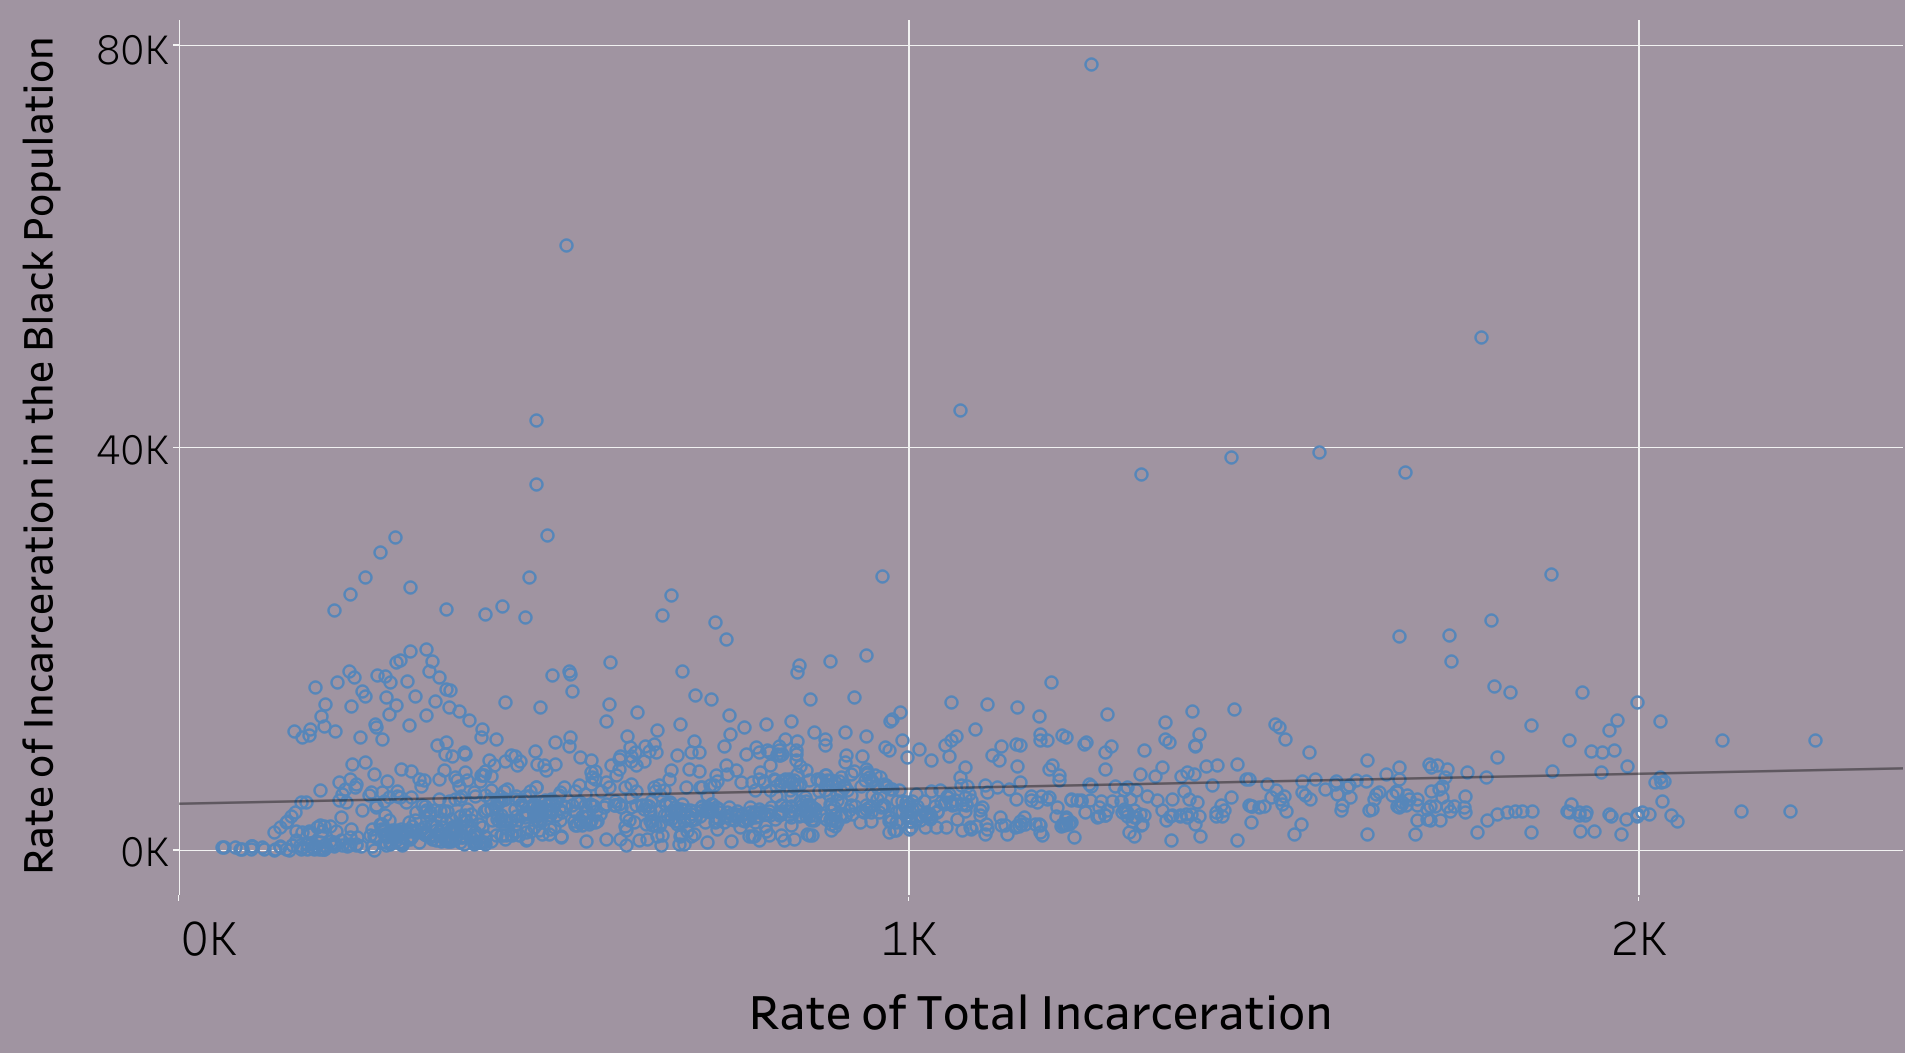
There is Little Correlation Between the Rate of the Incarcerated Black Population and the Total Incarcerated Population
This is illustrated by the graph, where the regression line is almost horizontal and there is high variance in the data points that fall far from the regression line.
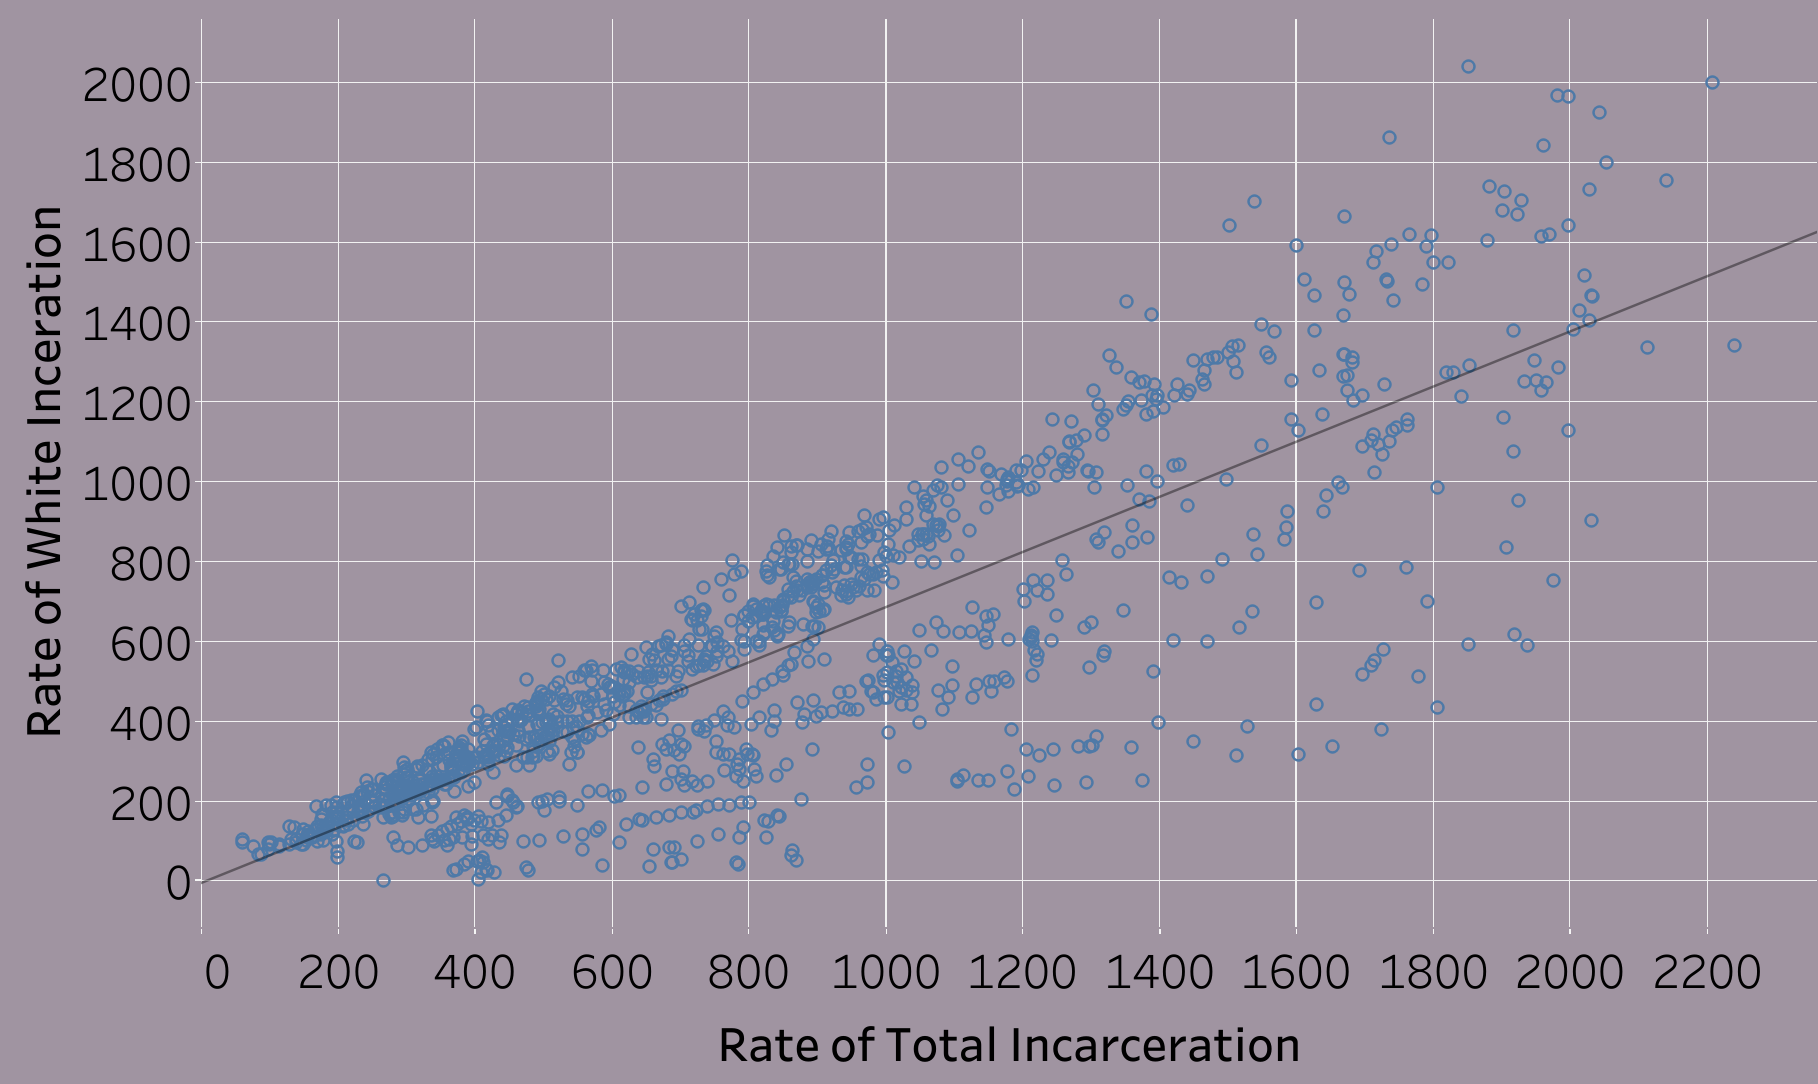
There is High Correlation Between the Rate of the Incarcerated White Population and the Total Incarcerated Population
In this graph, the regression line shows an upwards trend with much less variance in the data points.
Hypothesis: In the U.S. the rate of incarceration in the total population will not predict rate of incarceration in the Black population.
Hypothesis is True
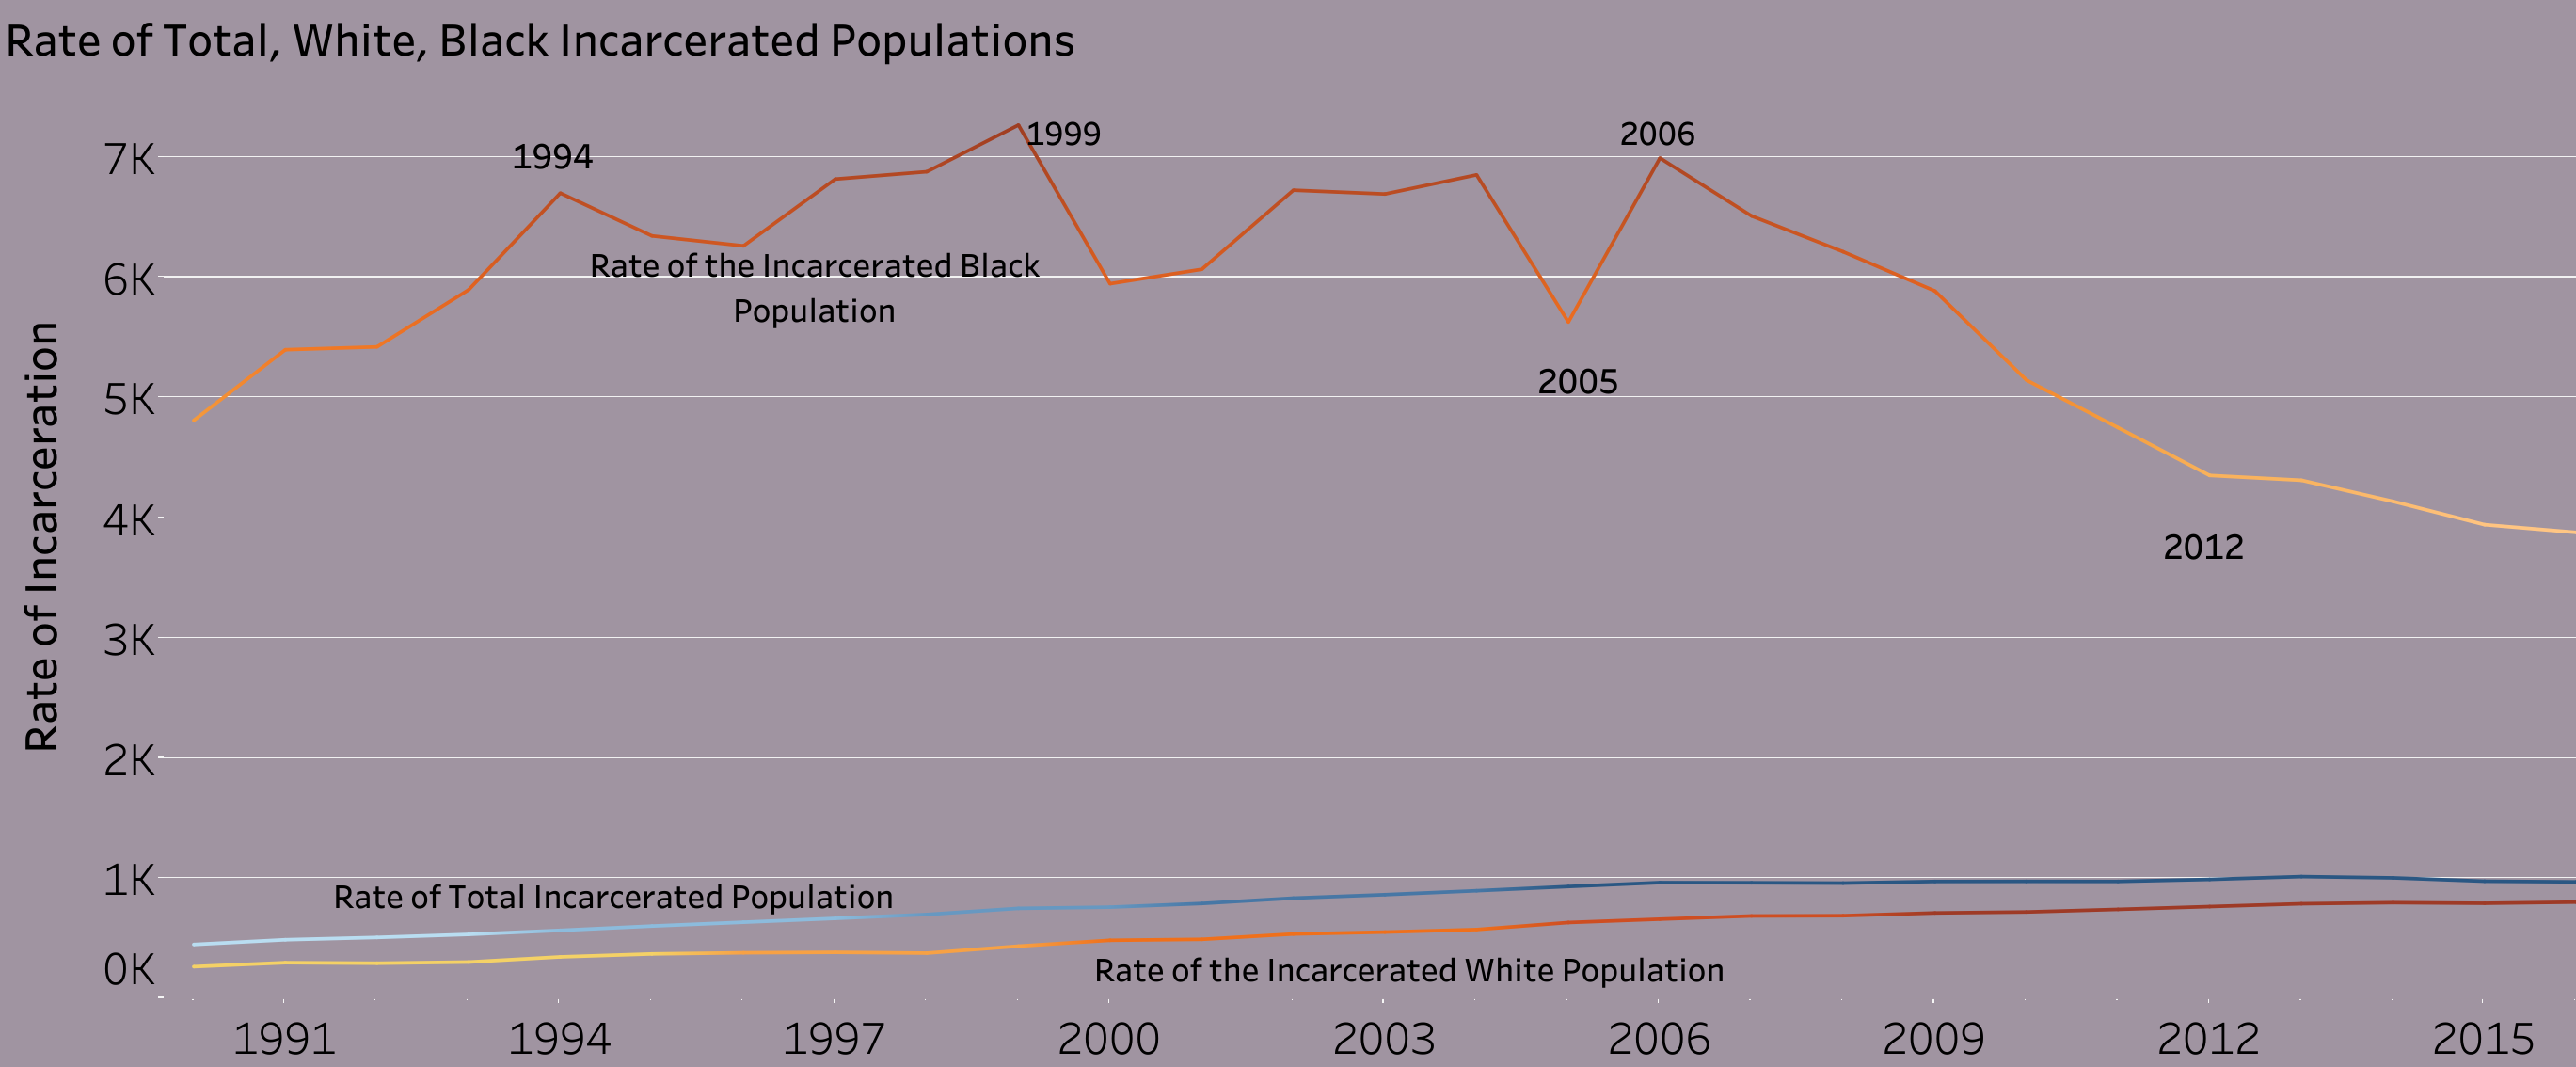
The rate of the incarcerated Black population is much higher than the rate of the total incarcerated
population.
It may be important to note the sharp downward trend in the rate of the incarcerated Black population while
the rate of the total incarcerated population is slowly rising.
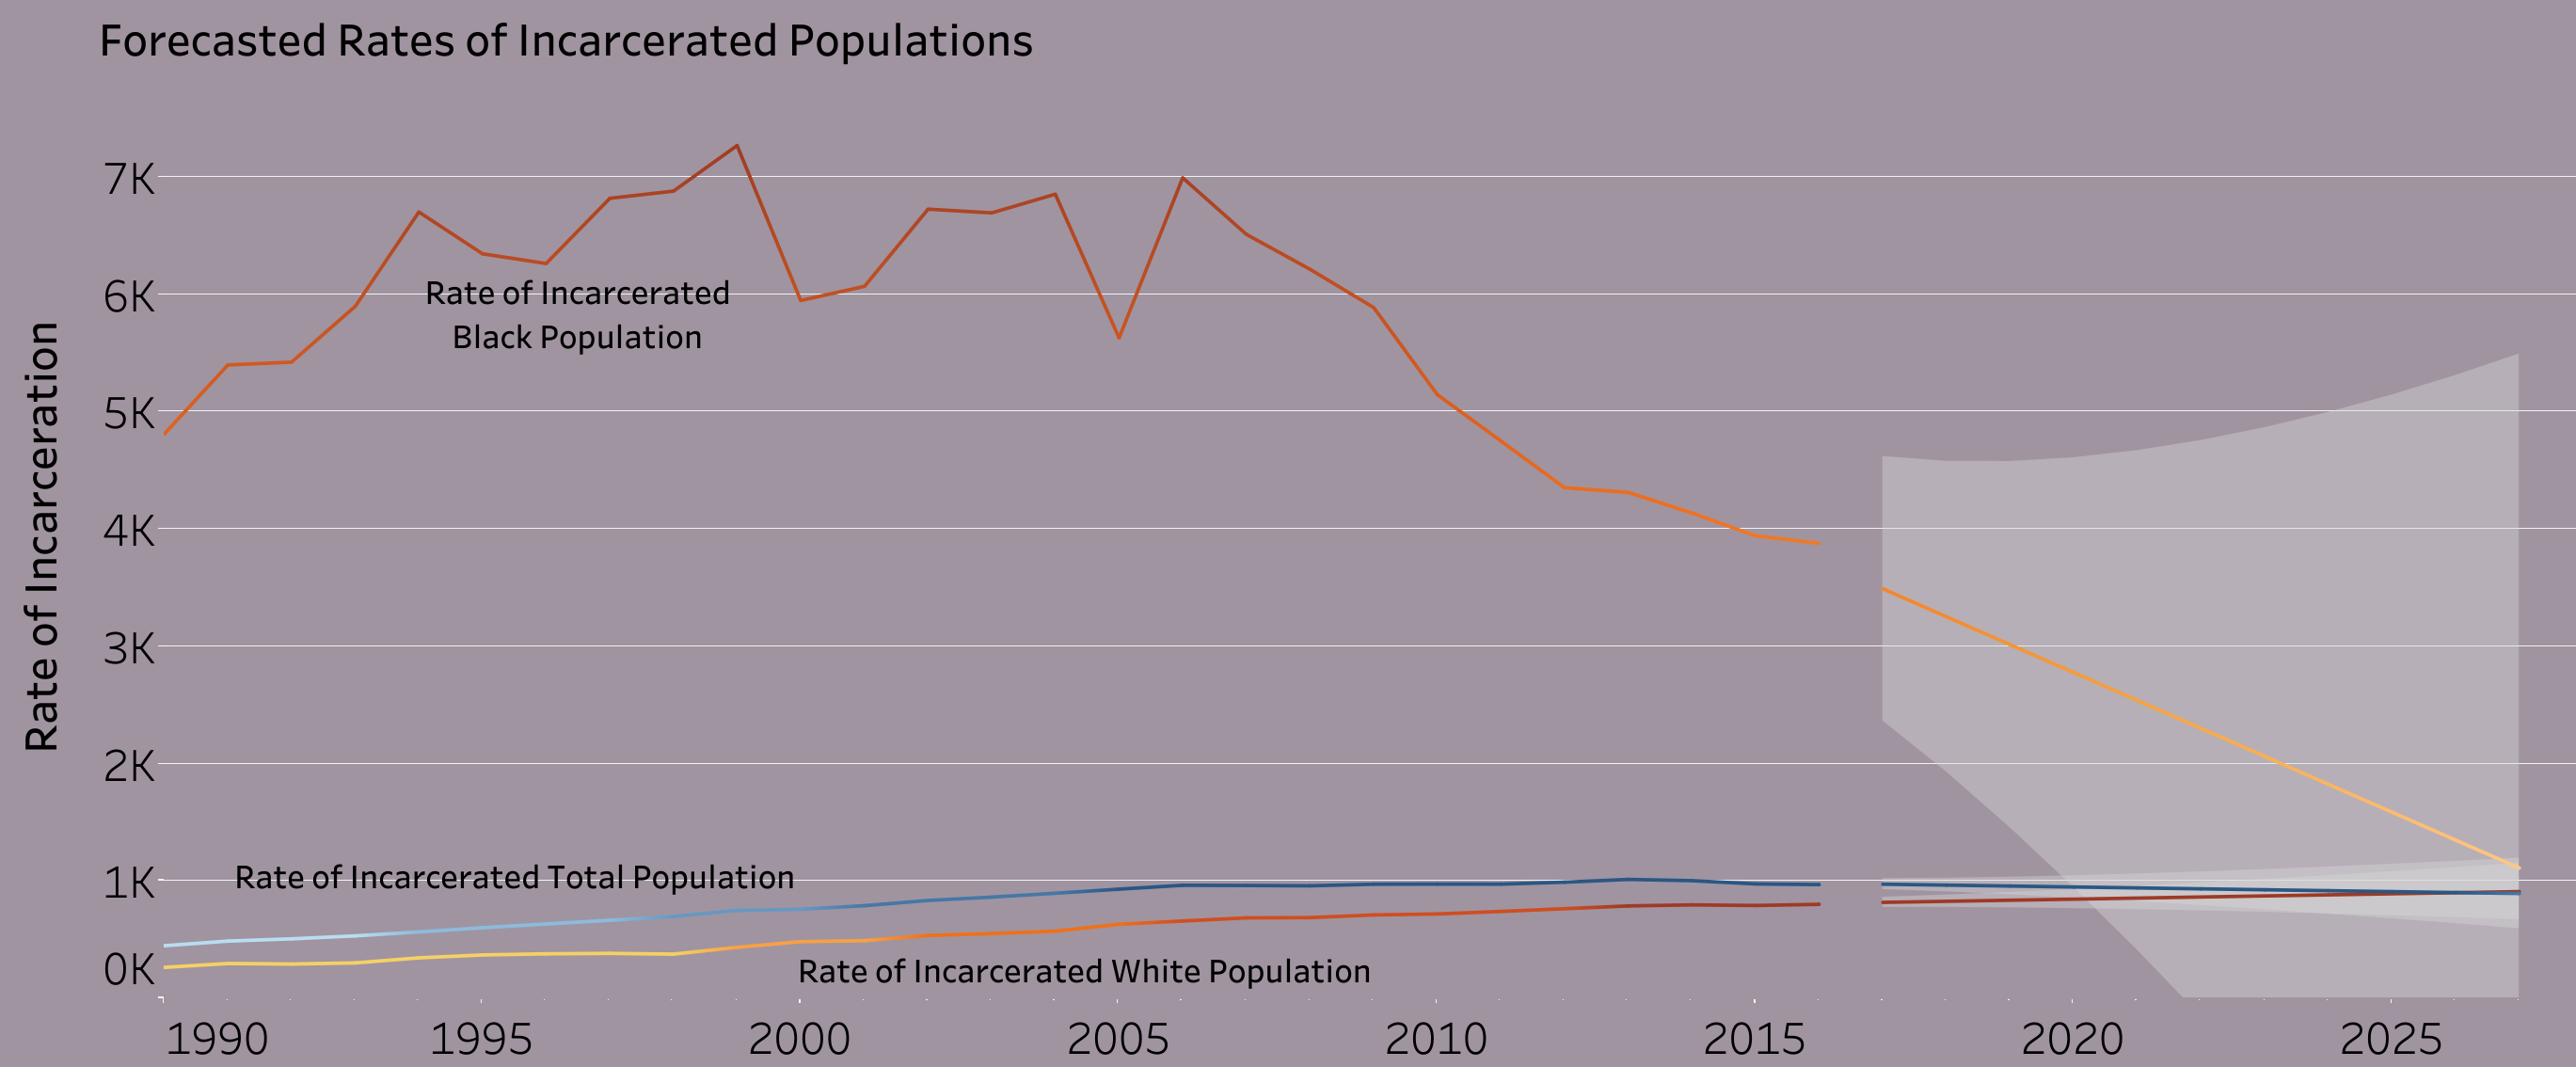
2027 Forecast
Using an additive model with no seasonality, the forecast shows the rate of the incarcerated Black population meeting the rate of total incarceration in 2027
Next Steps
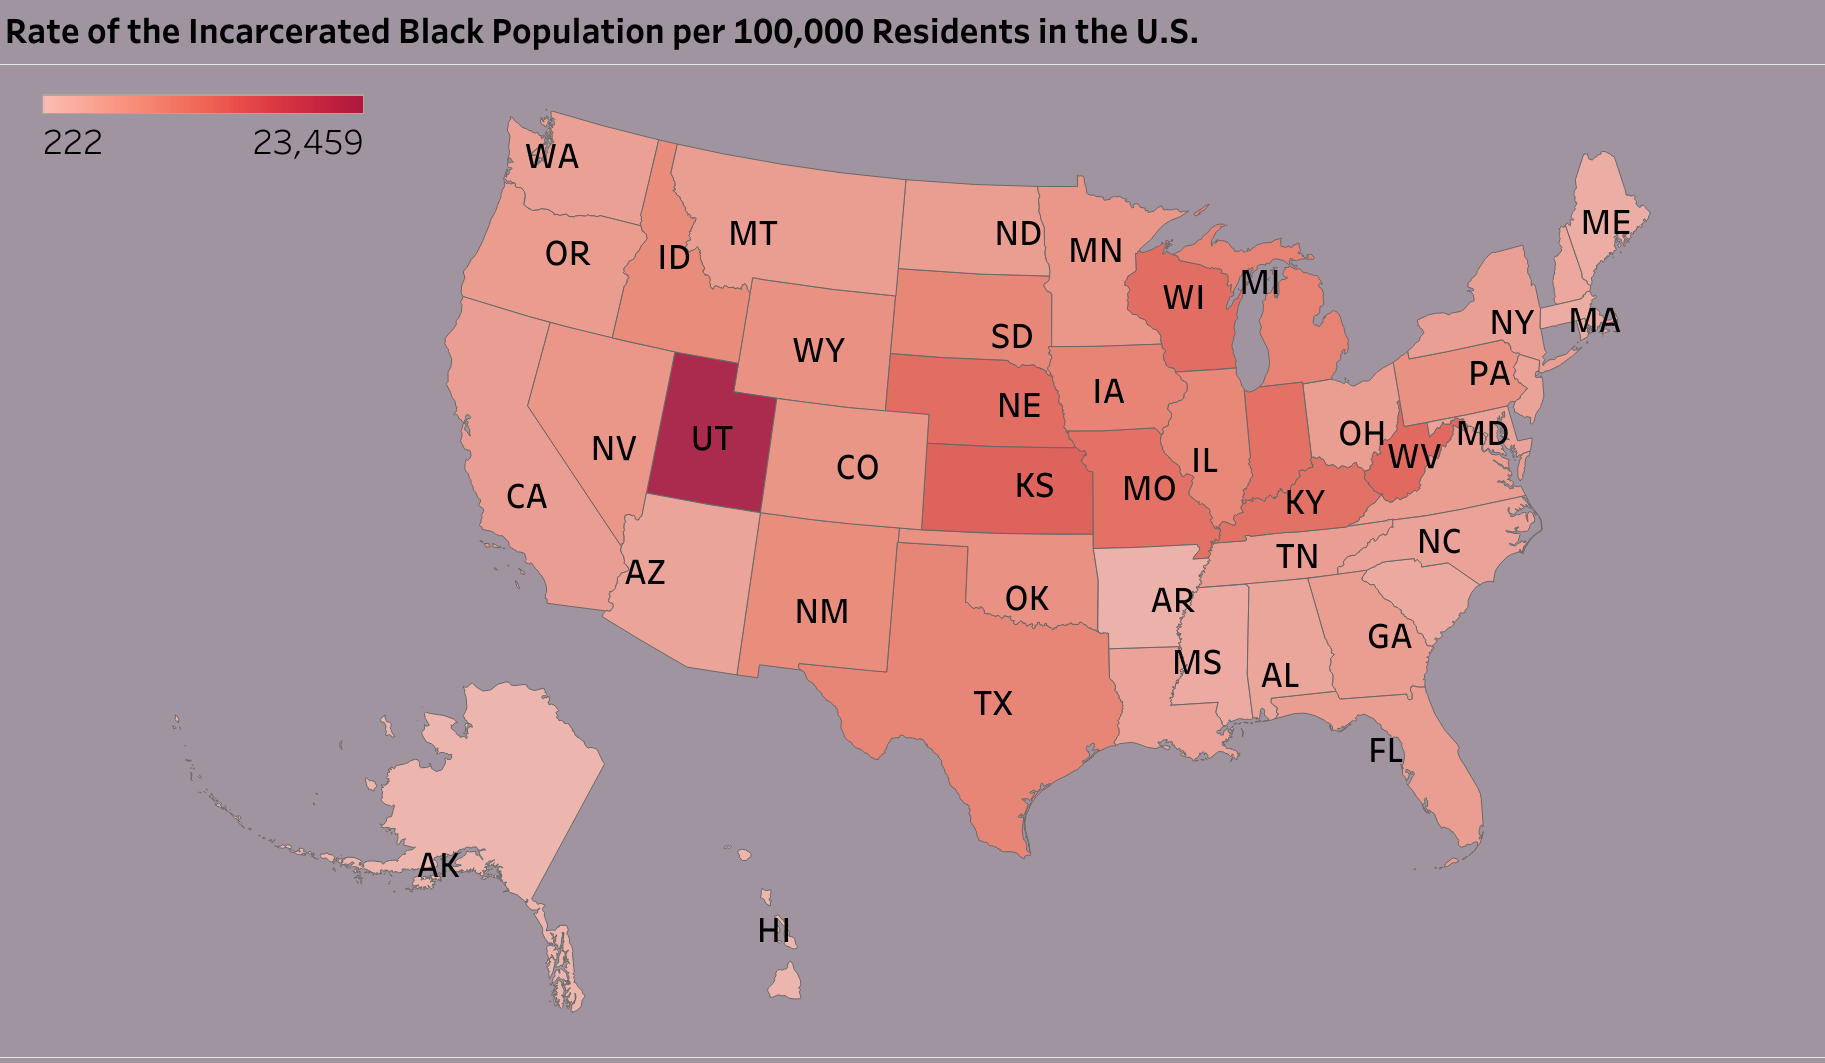
Since most incarceration is not on the federal level, but on the state and county1, one way to explore these trends is to look into the change in state, county and city laws from 1990-2016. As shown in the corresponding map, there is a large variation in the incarcerated Black population by state.
Notes
Endnotes
1 Criminal Justice Reform at the State Level, Brennan Center for Justice, retrieved 8/6/2021Data Sourcing
Data was sourced from the Vera Institute of Justice, retrieved 7/2/2021
Tableau
Interactive and Additional Visualizations